
Prefer to watch? Watch the Hometown Floor Covering case study. You can also watch Carlos’s original testimonial below.
Who Hometown Floor Covering is
Carlos Garcia owns Hometown Floor Covering in Shelbyville, Kentucky. The company sells flooring and installs it. That combination is most of why this account behaves the way it does: an inquiry that turns into an in-home estimate turns into a job his own crew does, so the money an ad produces lands inside one business instead of being split across two.
We have worked together for more than a year and a half. He is the lead case on our results page for the same reason he is first here. He has the longest run, and a long run is the only thing that tells you whether an ad account holds up after the first good month.
Where the store was before we started
When we met, Carlos was doing $25,000 to $30,000 a month. That is his own figure, given to us on a call, and it is the line everything below is measured against. These are client-reported figures, not audited accounts.
$25,000 to $30,000
a month, in the store's own words
What we ran
The offer is the same one on the homepage. Ads on Meta, Google and YouTube, fresh creative when the account needs it, conversion tracking and a CRM. Companies that add the call center also get human calling, qualification, booking and supporting text follow-up. How much of that a company takes is their own call.
Hometown runs on two ad platforms. The Meta account is the one on screen further down, and the campaign names in it are the ones you would expect from a booking funnel: PPM | Hometown | Booking Funnel, and a lead campaign named for the town it targets. There is a Google Ads account under the same roof. If you want the mechanics of either one rather than this account's story, we wrote them up separately for Meta ads and for Google Ads.
The chain, and where each number in it comes from
An ad account only means something if the chain holds all the way to the end. Money in. Leads out. Estimates on the calendar. Jobs sold. Revenue in the business. Those five numbers do not come from the same place, and pretending they do is how case studies start lying.
| Link in the chain | Who reports it | Proof on this page |
|---|---|---|
| Ad spend | Meta Ads Manager, our own account | Both captures below |
| Leads | Meta Ads Manager, counted when a form is filled in | The first sixty day capture |
| Booked estimates | ProfitPlus, from the booking records | None. It is our estimate, printed as a range and labeled as ours |
| Jobs sold and revenue | Carlos, on calls with us | His filmed testimonial, further down |
The first sixty days
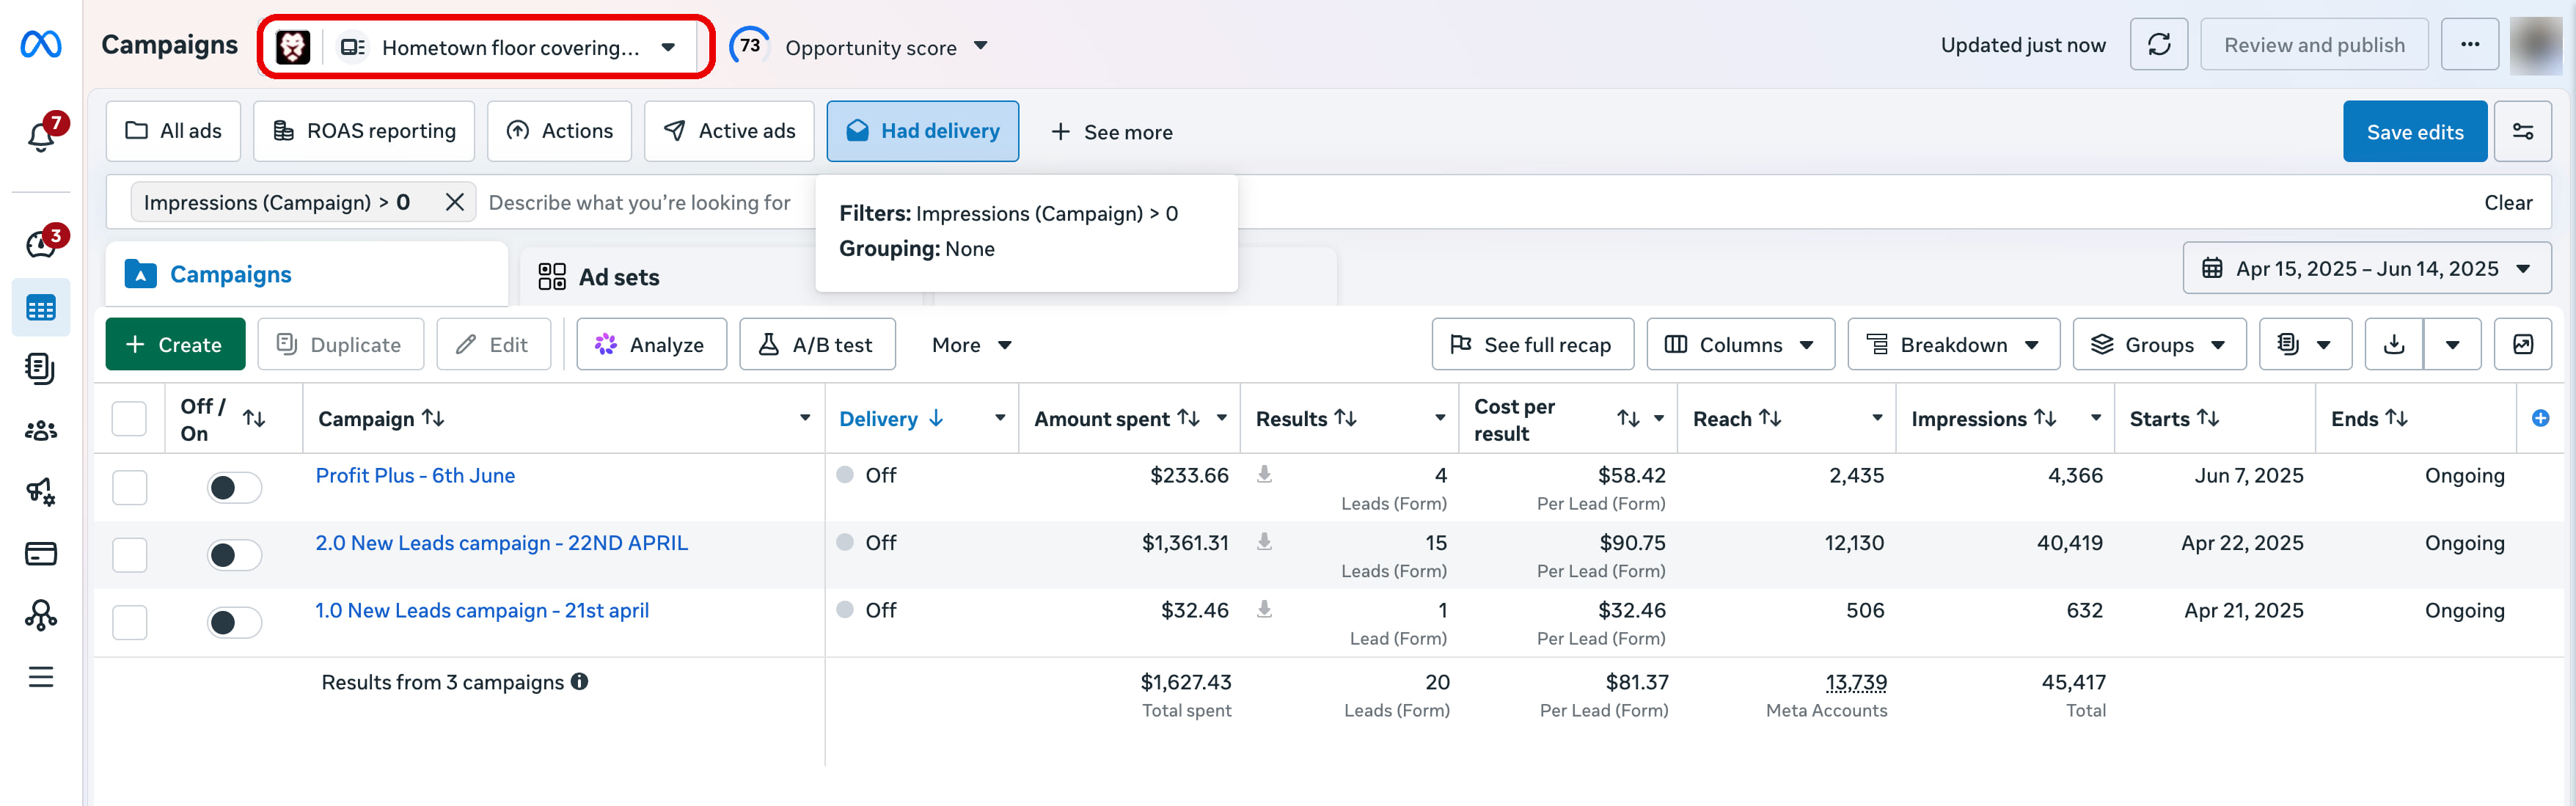
The Meta account opened in April 2025. Across the first sixty days, three campaigns ran and the account reported one clean result type all the way through, which is why this is the window with a lead count attached to it.
$1,627.43
spent on Meta across three campaigns
20 form leads
at $81.37 per lead
The whole run so far
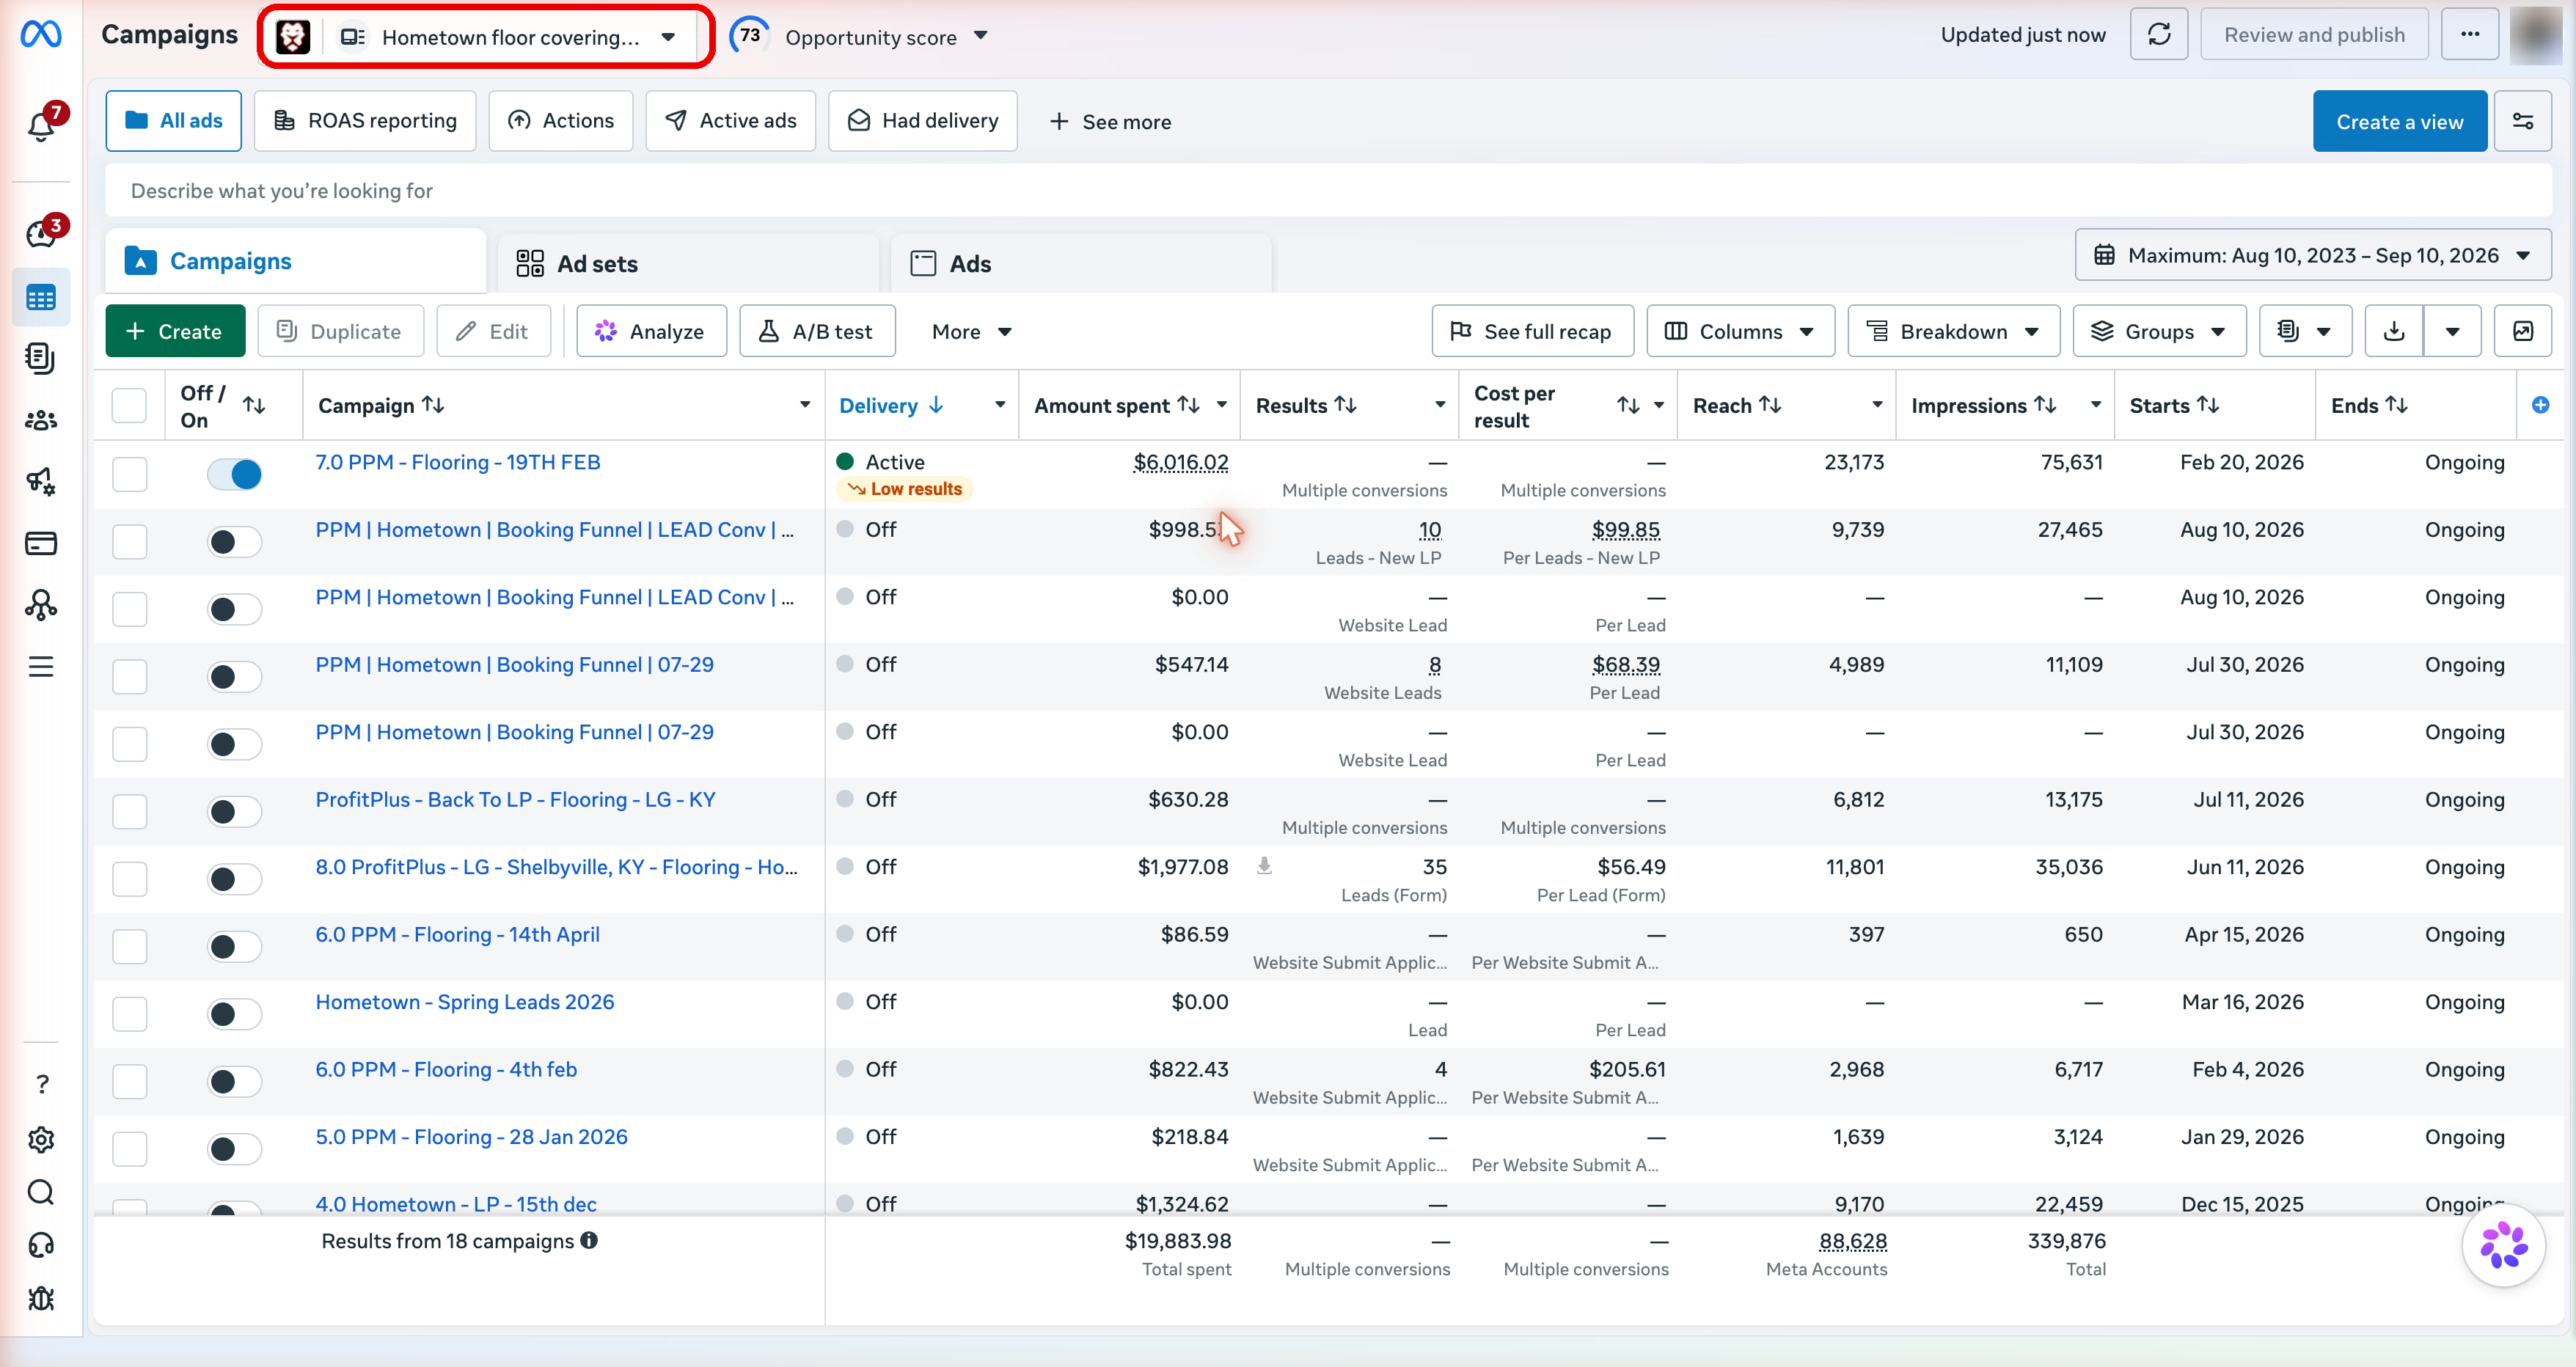
Read on September 10, 2026 with the date picker on its maximum range, the same account shows $19,883.98 spent across 18 campaigns, 339,876 impressions and 88,628 Meta accounts reached. The chip on that capture says Maximum: Aug 10, 2023 to Sep 10, 2026, and that is how far back Meta lets the picker go on this account rather than when the work started. The work started in April 2025, and the first capture is what shows it.
$19,883.98
spent on Meta across 18 campaigns
88,628
Meta accounts reached, from 339,876 impressions
Booked estimates, and the honest label on them
Roughly 40 to 50 percent of the leads booked an estimate, by our own reading of the booking records we keep for the account. That is our estimate, not a platform figure, and nothing on this page is calculated from it. There is no screenshot behind the rate itself, and we print it because leaving the middle of the chain blank would be the less honest option.
Jobs sold, and what the store does now
A year in, on a call, Carlos said the store was doing $68,000 to $70,000 a month. Five or six months further on he was doing $70,000 to $80,000 a month, consistently. Those are two separate readings and they stay separate here, each with its own date, because merging them into one band would be a claim nobody made.
$68,000 to $70,000
a month, said on a call
$70,000 to $80,000
a month, consistently
“$70,000 in the past half month.”
“About $2,500 a month of ad spend, $1,500 on Meta and $1,000 on Google. $70,000 to $80,000 a month back, and closing in on $100,000.”
Where our numbers and his do not line up
Two things on this page will not reconcile if you try to force them together, so here they are on purpose.
The spend. Carlos says about $2,500 a month across both platforms. The Meta capture says $19,883.98 for the entire life of the account, at budgets that changed several times along the way. His sentence answers what he spends now. The capture answers what has ever been spent. Averaging one into the other would produce a third number nobody has seen.
The results column. Meta reports a different result type per campaign depending on what the campaign was set to chase. In this account some campaigns report form leads, some report website leads, some report scheduled appointments, and six of the eighteen report multiple conversions. There is no honest single lead total for the whole account, so there is not one on this page.
The shortest version
An ad account running since April 2025. $1,627.43 and 20 form leads in the first sixty days, at $81.37 a lead. $19,883.98 spent on Meta across the whole run. A store doing $25,000 to $30,000 a month when we met and $70,000 to $80,000 a month now, consistently, in his own words. Every one of those has the window it happened in printed beside it, and the ad account is on screen below. The one page summary lives at the Hometown case file, and the wider argument this sits inside is on the flooring marketing agency page.